May 19, 2020
Foreign Trade 2020
The following is an excerpt of information and data presented in “Foreign Trade 2020”, published by the Japan Foreign Trade Council, Inc. (JFTC). The reader should note that it was prepared before the spread of coronavirus infection.
Export to Japan
Contents
- 1. Foodstuff
- 2. Wood
- 3. Mineral Fuels
- 4. Chemicals
- 5. Iron & Steel Products
- 6. Textile Yarn, Fabrics
- 7. Computers & Units
- 8. Semiconductors etc.
- 9. Audio & Visual Apparatus
- 10. Telephony, Telegraphy
- 11. Motor Vehicles
- 12. Ships and Aircraft
- 13. Scientific, Optical Instruments
- Top 10 Trade Commodities
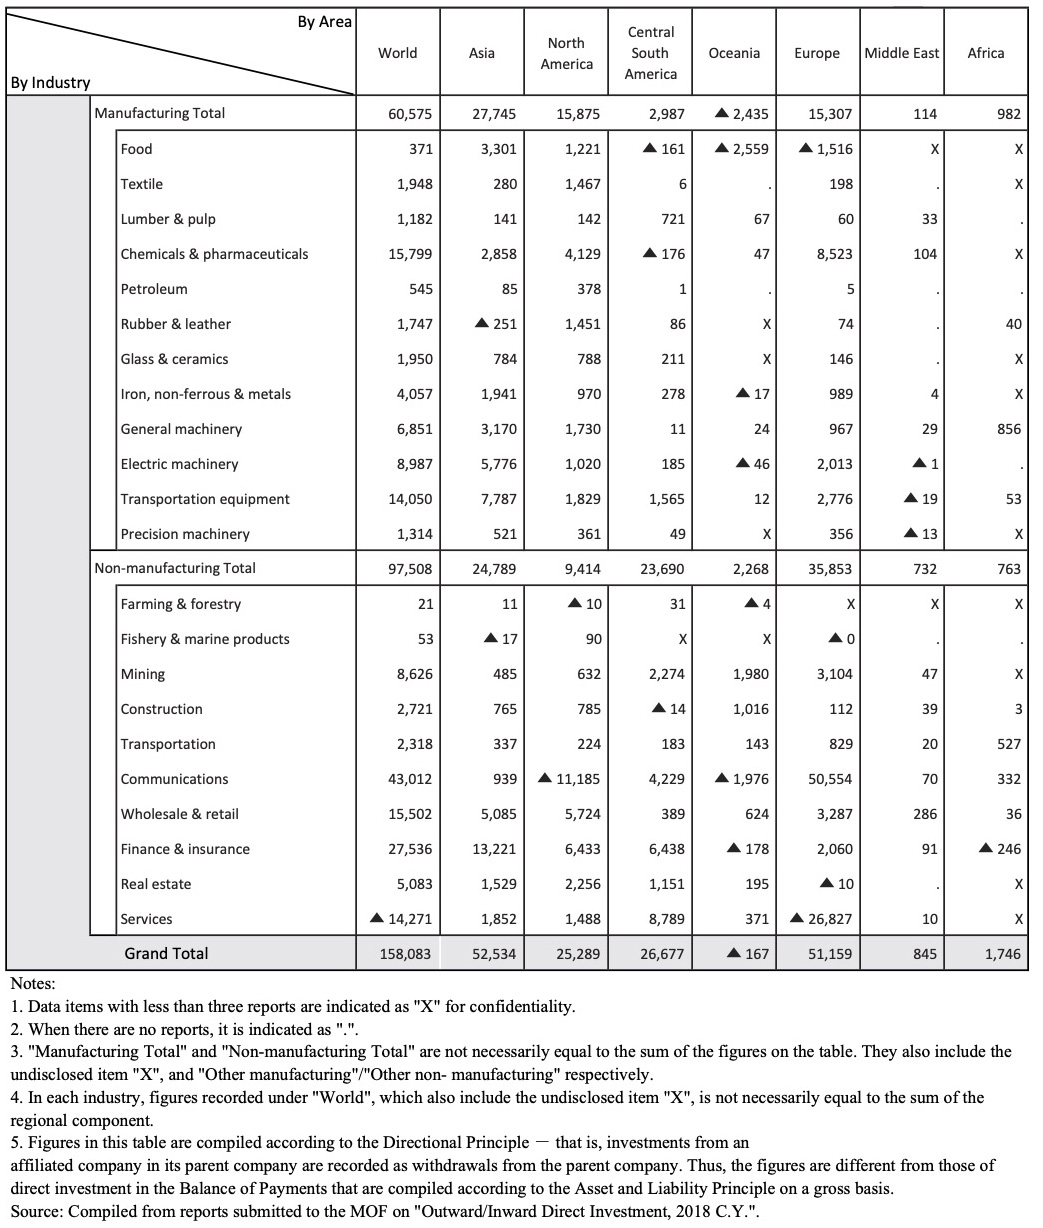
- Outward Direct Investment by Area and Industry (2018)
1. Foodstuff
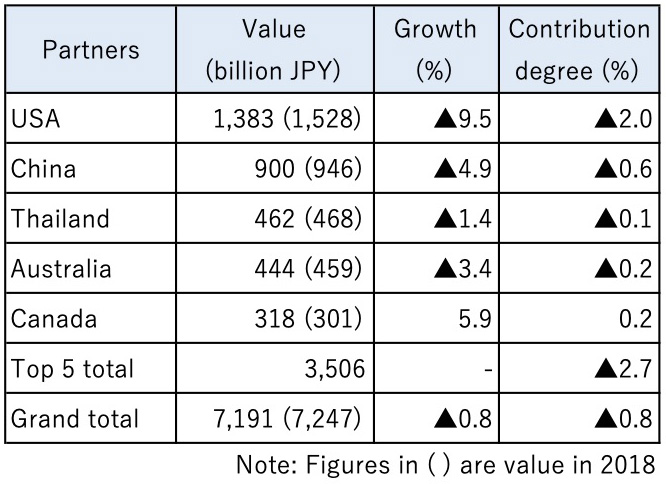
Foodstuff imports decreased after increasing for two years, falling 1% to ¥7.2 trillion. Imports of Fish & Fish Preparation declined 3% to ¥1.6 trillion (up 1% to 2.1 million tons). Imports of Vegetables went down 2% to ¥540.0 billion (down 4% to 3.0 million tons). Imports of Cereals, Cereal Preparation declined 1% to ¥800.0 billion (down 1% to 25.0 million tons). Among these, imports from USA went down 18% to ¥390.0 billion. Imports of Fruits dropped 2% to ¥540.0 billion (up 1% to 2.6 million tons). In contrast, imports of Meat & Meat Preparation rose 2% to ¥1.5 trillion (up 1% to 3.0 million tons).
Top Countries by Value of Imports
2. Wood
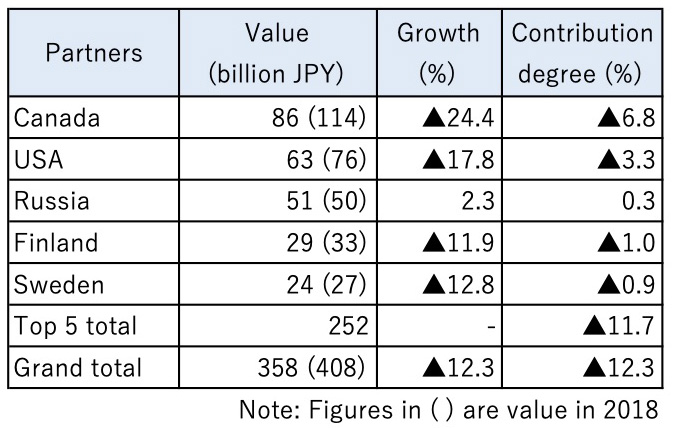
Imports of Wood from Canada went down 24% to ¥86.0 billion and imports of Wood from USA decreased 18% to ¥63.0 billion in North America. Imports of Wood from EU went down 7% to ¥91.0 billion with declined imports from Finland (down 12% to ¥29.0 billion) and Sweden (down 13% to ¥24.0 billion). Imports of Wood from Asia fell 6% to ¥43.0 billion with decreased imports from Malaysia (down 18% to ¥9.4 billion) and China (down 7% to ¥17.0 billion). Imports of Wood from New Zealand decreased 10% to ¥7.8 billion and imports of Wood from Chile fell 6% to ¥10.0 billion. In contrast, imports of Wood from Russia went up 2% to ¥51.0 billion.
Top Countries by Value of Imports
3. Mineral Fuels
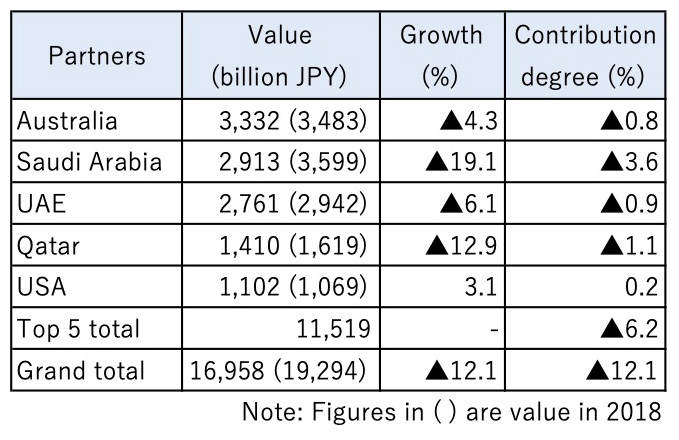
Mineral Fuels imports plummeted 12% to ¥17.0 trillion, which accounted for 22% of Japan’s total imports (down 1 percentage point from a year earlier) reflecting the falling crude oil price. Imports of Petroleum, which accounted for nearly 50% of the total and is the largest import item of all, declined 11% to ¥8.0 trillion (down 1% to 170.0 million kiloliters). CIF (cost, insurance, and freight) prices dropped for the first time in three years, falling 8% to $66.8/barrel. Imports of Petroleum Products declined 26% to ¥1.5 trillion. Imports of Petroleum Spirits, which accounted for over 70% of the total imports of Petroleum Products, went down 24% to ¥1.2 trillion (down 7% to 28.0 million kiloliters). Imports of LNG (Liquefied Natural Gas), which accounted for a quarter of the total, decreased 8% to ¥4.4 trillion (down 7% to 77.0 million tons). Imports of Coal fell 10% to ¥2.5 trillion (down 2% to 190.0 million tons). Among these, imports of Coking Coal went down 11% to ¥1.3 trillion (down 2% to 110.0 million tons). Imports of LPG (Liquefied Petroleum Gas) decreased 23% to ¥530.0 billion (down 2% to 11.0 million tons).
Top Countries by Value of Imports
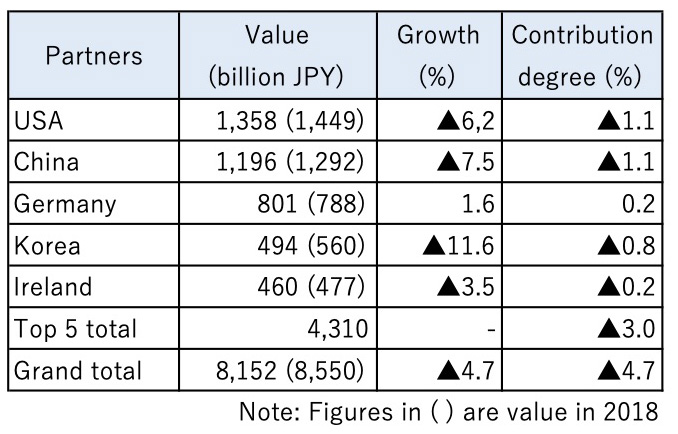
4. Chemicals
Chemicals imports decreased after two years of growth, falling 5% to ¥8.2 trillion. Imports of Organic Chemicals turned to decline, going down 13% to ¥1.7 trillion. In contrast, imports of Medical Products grew 4% to ¥3.1 trillion (up 3% to 110.0 million kilograms). By area and country, imports from EU declined 1% to ¥2.7 trillion with decreased imports from France (down 16% to ¥330.0 billion). Imports from China (down 7% to ¥1.2 trillion), USA (down 6% to ¥1.4 trillion), and Korea (down 12% to ¥490.0 billion) went down.
Top Countries by Value of Imports
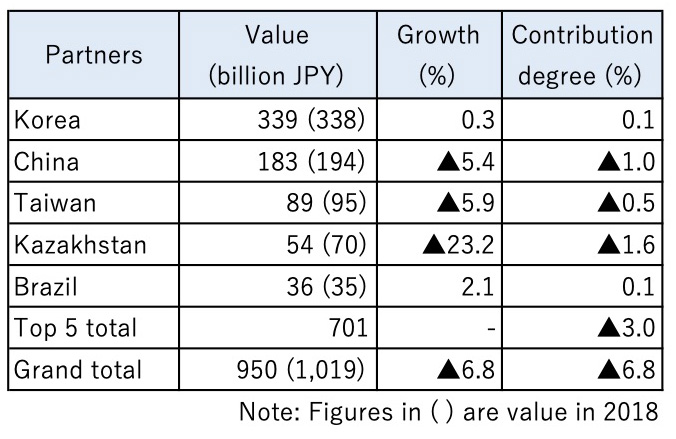
5. Iron & Steel Products
Iron & Steel Products imports decreased after increasing for two years, falling 7% to ¥950.0 billion (up 4% to 8.3 million tons). By area and country, imports from Asia went down 3% to ¥710.0 billion (up 5% to 7.0 million tons) with decreased imports from China (down 5% to ¥180.0 billion, up 17% to 1.5 million tons) and India (down 24% to ¥24.0 billion, down 12% to 210,000 tons).
Top Countries by Value of Imports
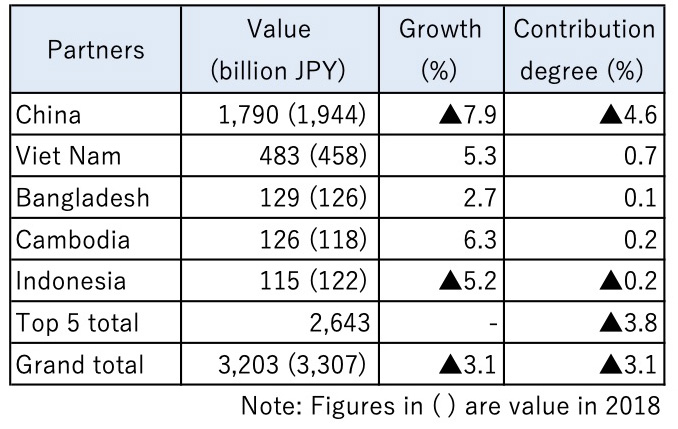
6. Textile Yarn, Fabrics
Imports of Textile Yarn, Fabrics declined after two years of growth, falling 2% to ¥950.0 billion. Imports from Asia, which accounted for nearly 90% of the total, went down 2% to ¥840.0 billion with decreased imports from China (down 4% to ¥510.0 billion). Imports of Clothing & Accessories declined after two years of growth, falling 3% to ¥3.2 trillion. By area and country, imports from Asia, which accounted for over 90% of the total, went down 4% to ¥3.0 trillion. Among these, imports from China, which accounted for over 60% of the total imports from Asia, dropped 8% to ¥1.8 trillion. Imports from Indonesia went down 5% to ¥120.0 billion.
Top Countries by Value of Imports
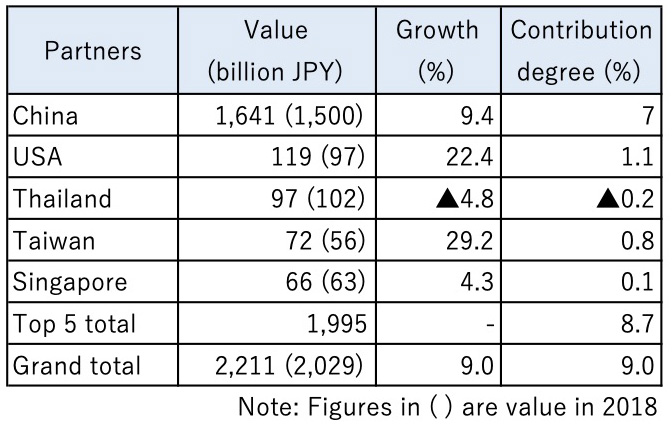
7. Computers & Units
Imports of Computers & Units increased for the third consecutive year, growing 9% to ¥2.2 trillion. Imports from Asia went up 8% to ¥2.0 trillion with increased imports from China (up 9% to ¥1.6 trillion). Imports from USA went up 22% to ¥120.0 billion. Imports from EU rose 11% to ¥56.0 billion.
Imports of Parts of Computer increased for the third consecutive year, growing 4% to ¥520.0 billion. Imports from Asia went up 5% to ¥490.0 billion. Among these, imports from China (up 5% to ¥360.0 billion), Indonesia (up 91% to ¥11.0 billion), and Viet Nam (up 27% to ¥15.0 billion) grew. In contrast, imports from EU decreased for the first time in seven years, falling 4% to ¥20.0 billion.
Top Countries by Value of Imports
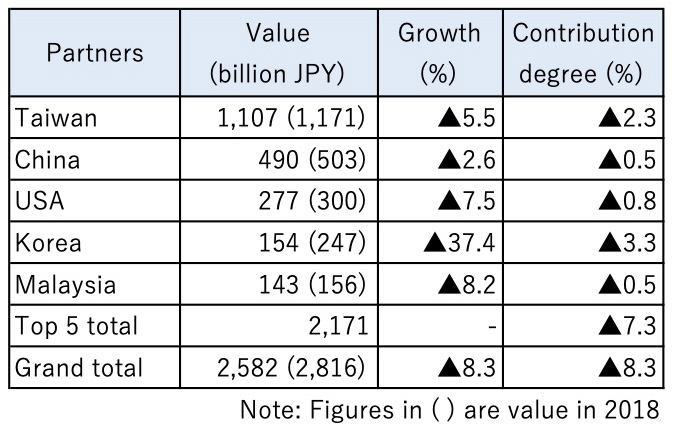
8. Semiconductors etc.
Imports of Semiconductors etc. decreased after two years of growth, falling 8% to ¥2.6 trillion. Imports of IC, which accounted for nearly 80% of the total, declined 9% to ¥2.0 trillion (down 2% to 21.0 billion units). By area and country, imports from Asia, which accounted for over 80% of the total, went down 9% to ¥2.2 trillion. Among these, imports from Korea (down 37% to ¥150.0 billion) and Taiwan (down 5% to ¥1.1 trillion) went down. Imports from USA decreased 8% to ¥280.0 billion. Imports from EU fell 7% to ¥120.0 billion.
Top Countries by Value of Imports
9. Audio & Visual Apparatus
Imports of Audio & Visual Apparatus increased for the third consecutive year, growing 8% to ¥1.4 trillion. Imports from Asia went up 7% to ¥1.1 trillion. Among these, imports from China rose 6% to ¥720.0 billion. Imports of Video Recording or Reproduction Apparatus, which accounted for a quarter of the total, grew 8% to ¥340.0 billion (up 10% to 35.0 million units).
Top Countries by Value of Imports
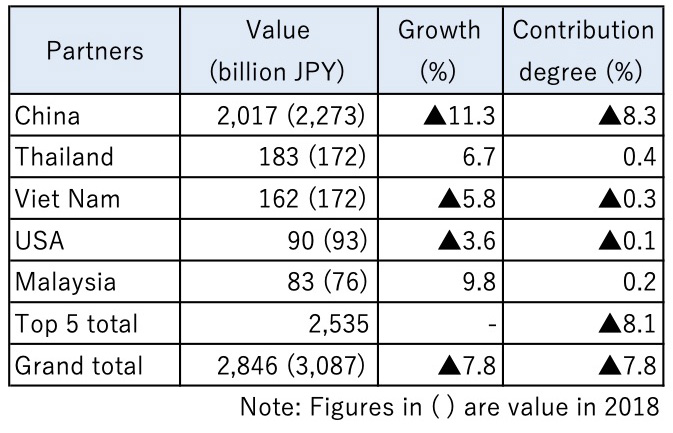
10. Telephony, Telegraphy
Imports of Telephony, Telegraphy decreased for the second consecutive year, falling 8% to ¥2.8 trillion. Among these, imports of Telephone Sets went down 14% to ¥1.7 trillion (down 6% to 33.0 million units). By area and country, imports from Asia, which accounted for over 90% of the total, decreased 9% to ¥2.6 trillion. Imports from China, which accounted for nearly 80% of the total imports from Asia, fell 11% to ¥2.0 trillion and imports from Korea declined 26% to ¥42.0 billion. Imports from USA dropped 4% to ¥90.0 billion and imports from EU went down 6% to ¥72.0 billion.
Top Countries by Value of Imports
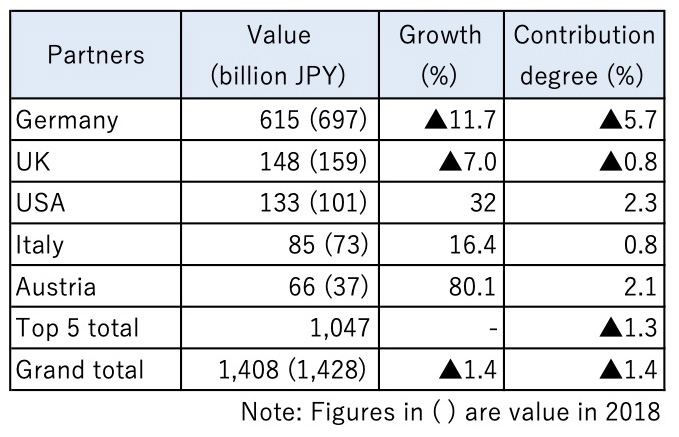
11. Motor Vehicles
Motor Vehicles imports declined after growing for three years, falling 1% to ¥1.4 trillion (down 6% to 360,000 units). Imports from EU went down 4% to ¥1.1 trillion (down 8% to 260,000 units). Imports from Asia decreased 4% to ¥71.0 billion (down 9% to 43,000 units). In contrast, imports from USA rose 32% to ¥130.0 billion (up 38% to 28,000 units). Imports of Parts of Motor Vehicles went down 10% to ¥890.0 billion.
Top Countries by Value of Imports
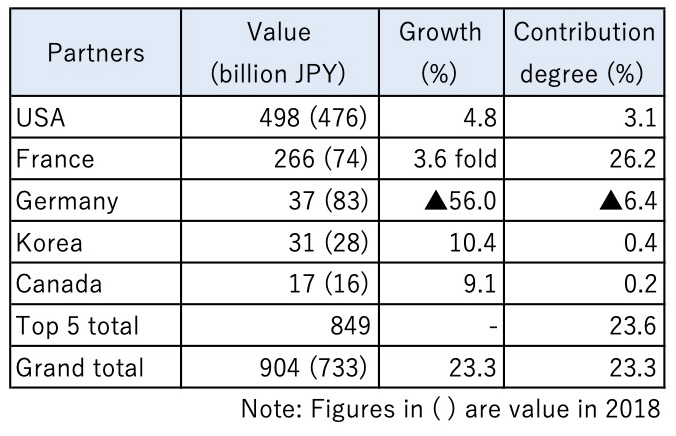
12. Ships and Aircraft
Aircraft imports rose for the second consecutive year, growing 23% to ¥900.0 billion (9,342 tons vs. 7,341 tons in 2018). By country, imports from France grew 3.6 times from a year earlier to ¥270.0 billion (1,633 tons vs. 521 tons in 2018). Imports from USA, which accounted for over 50% of the total, went up 5% to ¥500.0 billion (5,274 tons vs. 4,359 tons in 2018). In contrast, imports from Germany decreased 56% to ¥37.0 billion (240 tons vs. 535 tons in 2018).
Top Countries by Value of Imports
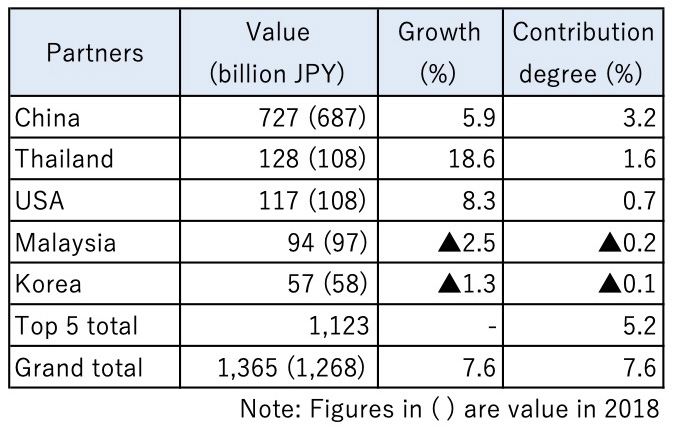
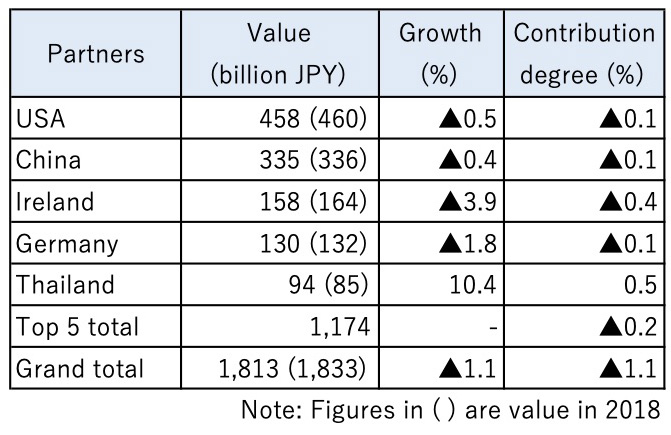
13. Scientific, Optical Instruments
Imports of Scientific, Optical Instruments declined after rising for two years, falling 1% to ¥1.8 trillion. Imports of Meters Instruments went down 1% to ¥360.0 billion and imports of Cameras & Parts fell 3% to ¥5.4 billion. By area and country, imports from Asia, which accounted for around 40% of the total, were flat from a year earlier at ¥730.0 billion. Among these, imports from China remained unchanged (¥330.0 billion). Imports from EU dropped 2% to ¥410.0 billion and imports from USA were flat from a year earlier at ¥460.0 billion.
Top Countries by Value of Imports
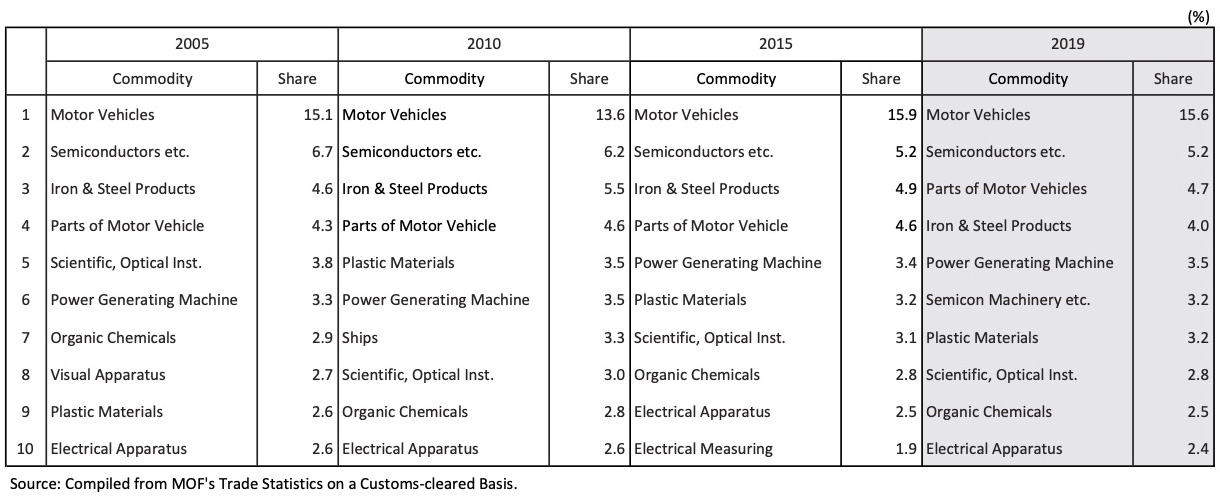
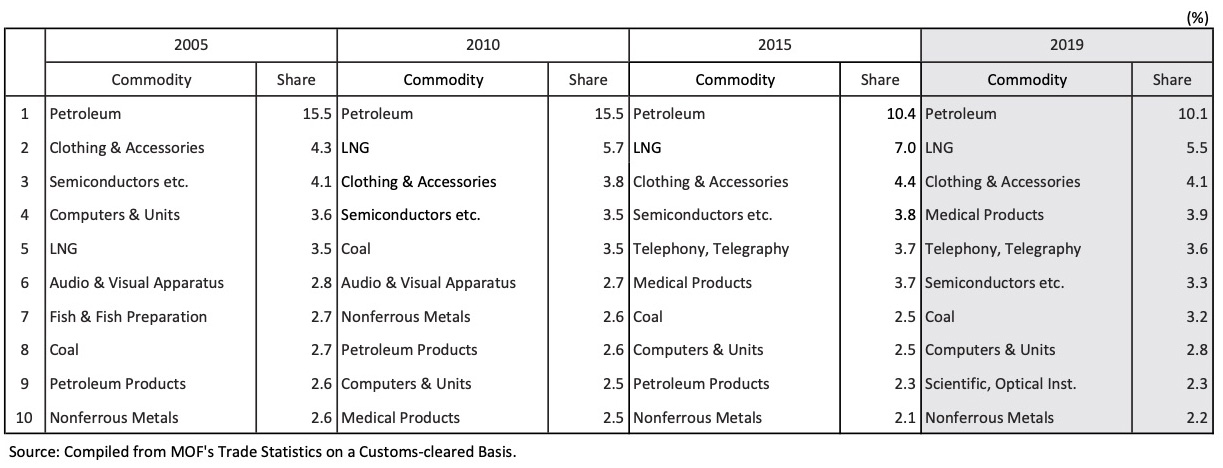
Top 10 Trade Commodities
Exports
Imports
Outward Direct Investment by Area and Industry (2018)